

Let’s be honest, with all the new AI tools and fancy dashboards out there, you would think Excel would be long gone by now. But surprise! It is still the go-to software in most offices, shops, schools, and homes.
You have probably used it yourself, maybe to track your spending, do some work reports, or even to keep score during family game night. And whether you are running a small café in Penang or handling budgets for a company in London, Excel just keeps showing up. It is reliable, simple to start with, and surprisingly powerful when you need to dig deep into data.
Let’s walk through 10 reasons why you will still find yourself opening up an Excel file in 2025 and probably for many years to come.
Microsoft Excel has been your go-to tool at home and work for decades, and it is still just as relevant today, even with newer tools popping up. Its versatility, user-friendly interface, and powerful features make it indispensable for all kinds of tasks. Whether you are managing your personal budget or analysing complex data, Excel adapts to your needs and delivers results.
Let’s look into ten compelling reasons why you can count on Excel to stay essential in 2025 and beyond.
Excel is almost like nasi lemak…everyone’s had a taste, and most people know how it works. You do not need to install anything fancy or pay for training. It is already on your laptop, or you can access it from the cloud.
Whether you are in admin, sales, finance, education, or operations, Excel skills are often expected. With over 1.3 million companies in the US alone using Microsoft 365, Excel is part of daily workflows worldwide.
Even small businesses, from local shops to independent contractors, rely on Excel to manage tasks like tracking orders, expenses, and stock. No accounting software, just a laptop, Excel, and well-organised spreadsheets.
Excel’s flexibility makes it suitable for managing a wide range of tasks, from client bookings and expense tracking to project timelines and file management. Its intuitive interface allows users to organise workflows efficiently, even without a technical background.
For example, you can use Excel to plan your monthly grocery budget, track wedding RSVPs, manage class attendance, or even list down your kuih orders for Hari Raya. The flexibility is unmatched.
At work, you can build:
It is like your all-in-one notebook, just smarter.
You do not need to be a programmer to make Excel work for you. If you can use a calculator and understand basic maths, you are already halfway there.
Many new users are initially intimidated by formulas, but Excel’s beginner-friendly functions like SUM, AVERAGE, and simple formatting tools make it easy to get started. With just a few basic commands, users can create clear, visually appealing charts and reports.
That’s the beauty of Excel. You do not need to write any code. Just a few clicks and basic formulas, and you can automate a lot of manual work.
You would be surprised how smart Excel really is. It has hundreds of built-in functions to do everything from calculating compound interest to working out your car loan instalments.
Excel makes it easy to break down costs for detailed analysis such as calculating cost per kilometre by factoring in petrol, tolls, maintenance, and time. It eliminates the need for manual calculations and provides a clear overview for better decision-making. Need advanced stats or financial projections? Excel can do it. Need to automate part of your workday? Learn a few formulas or record a macro, and you are good to go.
Big data doesn’t always require big software. With Excel, even datasets containing thousands of rows become manageable, thanks to powerful built-in tools like PivotTables and Power Query.
These features allow users to sort, filter, and analyse large-scale data such as survey responses by categories like age group, location, or satisfaction scores, all without any coding knowledge. If you are navigating a sea of raw information, these tools help you uncover patterns, trends, and actionable insights with ease.

You have probably heard the saying: “A picture is worth a thousand rows.”
Okay, that might not be a real saying but it is true!
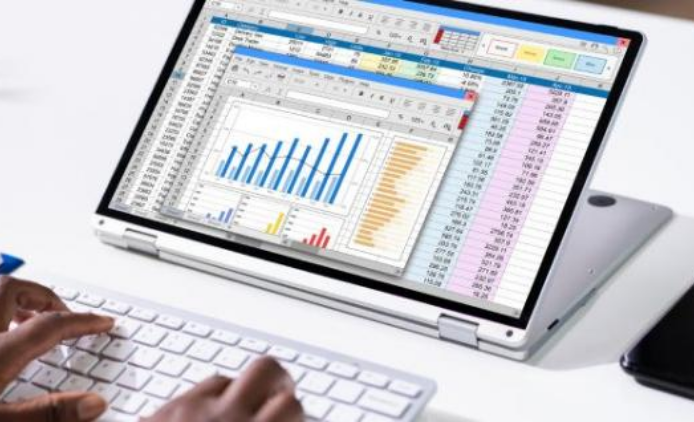
Charts and graphs in Excel are more powerful than you might think. You just highlight your numbers, click a few buttons, and you’re looking at pie charts, bar graphs, or line trends that actually make sense. Want to show which product sold best during Chinese New Year? Done. Want to compare three months’ worth of expenses? Easy. A well-designed bar chart in Excel can reveal inefficiencies such as time spent on low-priority tasks and support data-driven decisions, including changes to workflow or time management policies.
Excel is not stuck on your desktop anymore. With Microsoft 365, you and your teammates can edit the same file in real time whether you are in Shah Alam or Stockholm.
With cloud integration via OneDrive, Excel enables real-time collaboration across teams and locations. Team members can update shared spreadsheets simultaneously, ensuring accuracy, eliminating version confusion, and streamlining daily reporting, all in one centralised document. You can even see where others are typing. It is like Google Docs, but for grown-up data.
Excel is like that friendly colleague who gets along with everyone. You can import and export files in almost any format, from CSVs to PDFs. You can link it with Microsoft Word, PowerPoint, and even pull data from websites or databases.
The Excel mobile app includes a feature that allows users to capture images of printed tables and convert them into editable spreadsheets. This tool is especially useful for digitising physical records quickly and accurately, enhancing productivity and data accessibility.
If you work in a place where multiple tools are used, Excel often becomes the final stop where everything is cleaned, analysed, and presented.
If you have not tried the new features yet, you are in for a treat. Excel now includes AI-powered suggestions, natural language queries, and even lets you use Python code directly inside a cell.
Copilot (Microsoft’s AI assistant), can generate a PivotTable and line graph in seconds just from a plain-English prompt. This means you don’t just use Excel anymore. You talk to it. It is like having a mini data analyst sitting quietly in your laptop.
For example, you can ask Excel in plain English to “summarise this table” or “create a trend chart,” and it does it.

Finally, Excel is reliable and that is a big reason why it remains a staple in both education and the workplace. Employers trust it, schools teach it, and millions of users turn to it daily for everything from budgeting to complex data analysis.
What makes Excel even more powerful is the global support community behind it. Whether you are trying to apply conditional formatting for overdue invoices or build a dashboard, chances are someone has done it before and shared a tutorial, forum response, or step-by-step guide online.
YouTube, Excel blogs, and platforms like Stack Overflow are filled with practical solutions and tips.
From solo freelancers in Bukit Bintang managing client data to multinational teams in New York crunching enterprise-level reports, Excel continues to serve as the go-to tool for data handling. It is accessible, well-documented, and constantly evolving. That is why Excel remains a dependable, long-term solution in the modern workplace.
So, next time someone tells you Excel is outdated, just smile. You know better.
It is not just a grid of rows and columns, it is a toolkit that is helping people all over the world, every single day. From small shops to corporate towers, Excel is still getting the job done. And with new features rolling out every year, it is only getting better. So go ahead, open that spreadsheet and give your data the attention it deserves.
BloomSkillz is your HRD-Corp training provider and trusted partner for high-quality learning and development. Whether you are an individual aiming to future-proof your career or a business ready to unlock new growth opportunities, BloomSkillz offers practical, skill-based training led by expert instructors. With a wide range of courses covering digital marketing, IT knowledge, business intelligence, and more, BloomSkillz has programmes tailored to your needs.
Start learning today with BloomSkillz and empower both your team and yourself to grow and succeed through sustainable change.